
Predictive Solutions Imago Pro
ANALYTICAL SOFTWARE FOR PROFESSIONALS
IBM SPSS Statistics and PS IMAGO Pack PRO
IBM SPSS Statistics is a proven and leading tool for quantitative data analysis. A number of modules offer numerous techniques for such tasks as descriptive analysis, prognosis and prediction, and classification and grouping. 41 additional procedures of PS IMAGO Pack PRO greatly enhance the functionality of IBM SPSS Statistics. They offer data set management, variable transformation, and variable dependency analysis methods that were unavailable until today. Apart from the new techniques, PS IMAGO Pack PRO provides a number of new types of result visualisation methods e.g. dashboards or juxtaposed charts.
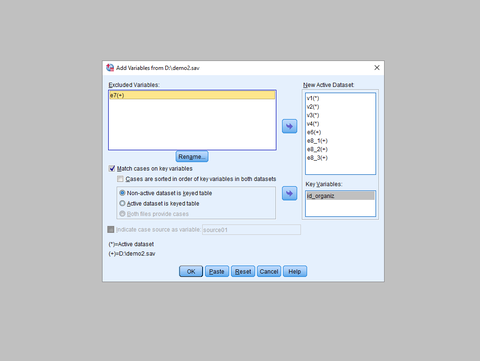
Data managing
The application gives a convenient access to data from various sources thanks to its data import creators for spreadsheets such as Excel, text files, or databases such as Oracle, MS SQL Server, and DB2. It can merge datasets by adding observations or variables. Observations from two files can be matched correctly using variables that act as merging keys. Using commands, you can merge up to 50 datasets at once. You can also change how data in a set is organised or the level of aggregation of data. The available aggregation functions include summary statistics (average, median, sum, standard deviation) and specific values (the first and last one, minimum, maximum). The application can define and store metadata, which is properties of variables displayed in dialogue boxes and used to describe result objects. You can also assign attributes to variables and define absence of user data.
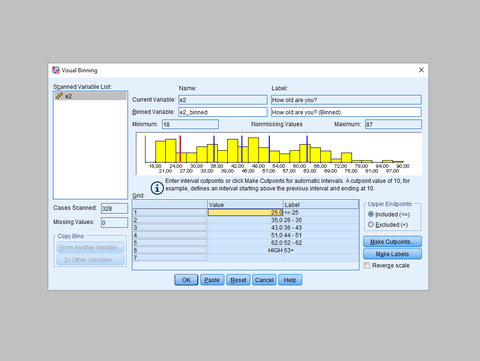
Data preparation
PS IMAGO PRO offers a plethora of tools crucial to the preparation of data prior to analysis: data cleansing, for cleaning up databases and managing gaps in data; data quality assessment, for identifying incorrect values, duplicates, and atypical observations, or ‘anomalies’; data exclusion techniques, for the correct handling of observations containing too many data gaps, or their replacement using different methods; data transformation procedures, allowing for the categorization, standardization, and calculation of new variables using algebraic transformations, logical operators, global values, and various other functions; special techniques for handling multiple response data, allowing for the creation of multiple response sets that are easier to analyze.
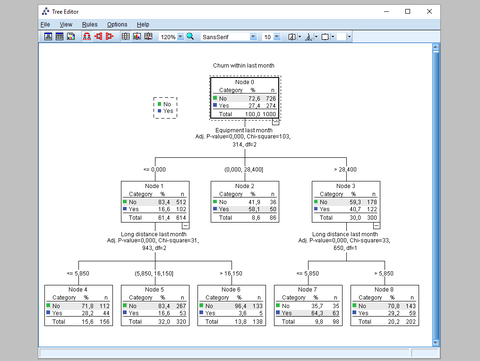
Data analysis
PS IMAGO PRO provides a vast array of tools and techniques for quantitative data analyses: basic statistics, for presenting frequency distributions or calculating descriptive statistics; statistical tests - both parametric and non-parametric, for analyzing dependencies between variables; a broad range of multidimensional data analysis techniques; predictive analyses, such as regression and time series forecasting; data reduction techniques, for grouping similar observations and identifying correlation patterns in a group of variables, and their graphic representation in a perceptual map, useful for product positioning.
Data presentation and visualization
PS IMAGO PRO boasts an extensive range of techniques to present data in the form of tables, or visualize data in the form of charts and maps. With tabular reports, the user has full control over the display of the content of cells, the dimensions of the table, and its structure. Data visualization is made possible with graphical forms such as: bar charts, pie charts, box charts, linear plots, layered charts, histograms, scatter plots, max/min charts, and many others. In addition, non-standard visualizations are also available, such as contingency maps, Marimekko charts, table charts, and dashboard visualizations. Data may also be presented in a geospatial context using maps divided into regions, or other divisions defined by the user. Each graphic may be edited, and modifications saved as a template for later use. Finally, a central portal offers a convenient way of managing all the results of analyses.

Kontakt
2x4 Solutions GmbH
Eichenring 23a 84562 Mettenheim Deutschland
Telefon: +49 8631 3516525 Email: info@2x4.de
Contact
2x4 Solutions GmbH Eichenring 23a 84562 Mettenheim Germany
Phone: +49 8631 3516525 Email: info@2x4.de
Hinweis
Unser Angebot richtet sich ausschließlich an gewerbliche Kunden. Alle angegebenen Preise zzgl. ges USt. Für Firmenkunden aus der EU (nicht Deutschland) wird das umgekehrte Mehrwertsteuerverfahren angewendet, wenn uns eine gültige UST-ID vorliegt.
Notice
Our offer is for business users only. All shown prices are net values and VAT will be added. If we know the customers VAT ID, we will use reverse VAT for EU-companies outside Germany.
